Introduction
Hit musical numbers from the blockbuster movies ‘Dilwale Dulhania Le Jayenge’ and ‘Titanic’ continue to occupy a special place in people’s hearts even today. This might make you think: What are the secret ingredients of music that enrapture all of us and how does it add magic to the movies? With this thought in mind, we will use the CMU Movie Summary Corpus and our Spotify Dataset to find out the dominant music attributes (danceability, energy, liveness, etc.) in different countries across the world so as to possibly reveal country-specific music styles for the top 3 countries (in our combined movie and music dataset). Subsequently, we will observe the change in music features and their interplay with the changes in the emotions portrayed by movies in the top 2 countries (in our combined movie, music and emotion dataset) across the years. Finally, we will connect all the dots to reveal how music moves movies towards success. Let’s dive deep into the world of music and movies!
Deciphering Country-Specific Music Styles
Movie Metadata Dataset (CMU Movie Summary Corpus)
After some pre-processing, we found out that this dataset contains a total of 81734 unique movies. Let’s now see how these movies are distributed across different genres, countries and languages!
We can clearly see that the United States of America is producing the most films, followed by India and the United Kingdom. The top 10 countries represent ~ 79.3% of the movies in the dataset (~ 58.6% for the top 3). As we then expected, the English language is the one with the most movies in the dataset and makes for more than half of the the data. The rest of the languages: ‘Hindi’, ‘Spanish’, ‘French’, etc. are far more similar in abundance. The top 10 languages represent ~ 80.4% of the movies (~ 59.4% for the top 3). Additionally, the top 3 genres of films are Drama, Comedy and Romance and are more equally represented than the languages and countries. The top 10 genres represent ~ 47.8% of the films (~ 24.9% for the top 3 genres). We can therefore continue our analysis using the top 10, or top 3, countries and/or languages and/or genres when the plots are too overlapping.
Let’s now understand how runtime and box office revenue differs across the movies of the various genres, countries and languages!
For clarity, we only show the boxplots from which we could discern interesting insights! We found out that overall, the boxplots for movie box office revenue across movies of the top 10 genres overlap so we can’t really draw any conclusions as to the link between genre and box office revenue. Also, as can be expected, short films have a significantly shorter runtime than the other movie genres. Jumping on to the interesting facts, for the countries, we can clearly notice the longer runtime for Indian movies in comparison to movies from the other countries. This fact is also supported by the runtime boxplot of the top 10 languages, wherein the movies in the Tamil and Hindi languages seem to have a longer runtime when compared with movies in the other languages. However, as is evident from the boxplots of the box office revenue, the trend seems to be towards lower revenues for Indian movies and higher revenues for German movies. This trend is also reflected in the language category: Tamil language movies (and silent movies) earn less than movies in languages such as German, Japanese or Spanish. Note, however, that this is not true for Hindi language films. From the lineplots, we can also see that the runtime of Indian movies (and movies in the Hindi language) are higher than movies from the other top 3 countries and languages. We’ll be taking a closer look at these variations in the context of music. For that, let’s now take a closer look at the music dataset.
Spotify Dataset (Combined with the Movie Metadata Dataset)
We were able to scrape music data for 14055 movies (~ 17.2%) of the movie metadata dataset from Spotify. This is a sufficiently high number since not all movies have music in the first place! Our music album data for every movie includes the music album’s popularity and music album averaged danceability, acousticness, instrumentalness, liveness, valence, duration, loudness, energy and tempo. Let’s now have a look at the scatter plot matrix of all these music attributes across different movies!
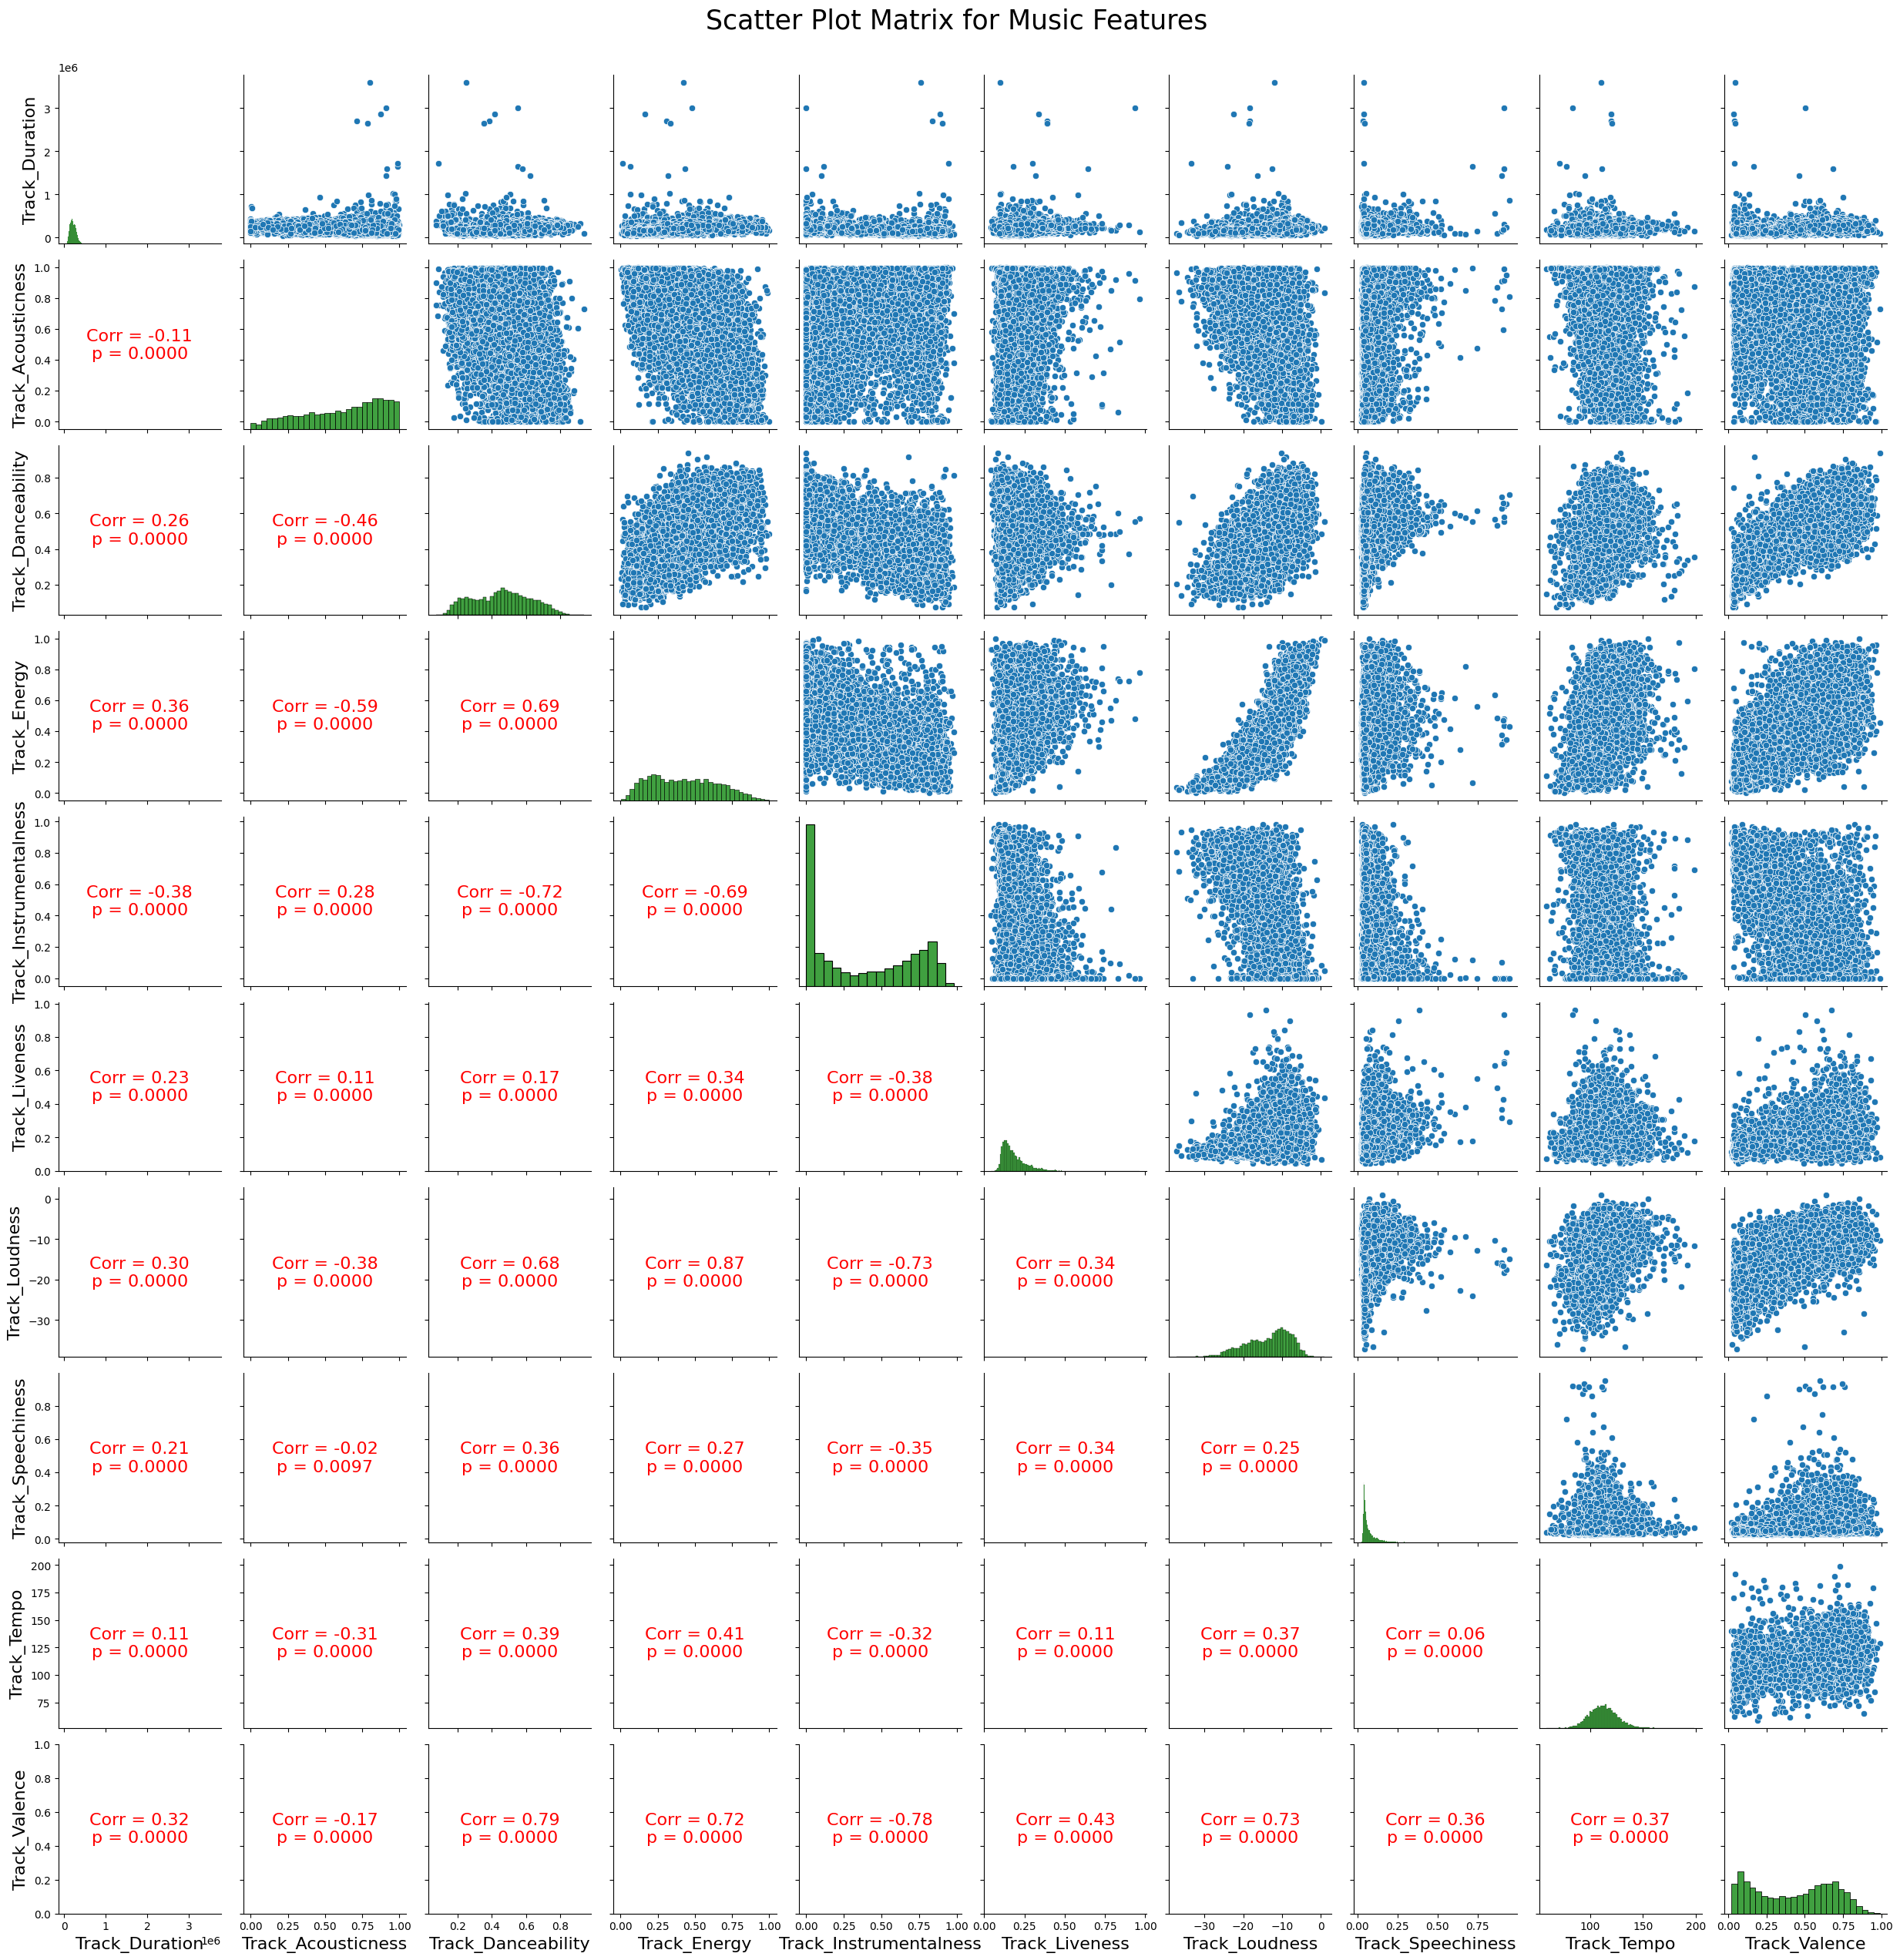
As we could expect, some of these music features are strongly correlated (with a correlation coefficient > 0.75 which is also significant). Loudness explains energy while danceability and valence and liveness and valence also go together, as valence is a measure describing the positiveness conveyed by a musical track. We will take these correlations into account while determining the impact of these music features on a movie’s success. But for now, let’s turn to examine how the movies which contain music are distributed across different languages, countries and genres!
As expected, the English language is again the major one followed by Hindi. The rest of the languages are far more similar in abundance. The top 10 languages represent ~ 82.2% of the films (~ 62.1% for the top 3 languages). The United States of America and India have the most films with music, followed by the United Kingdom. The top 10 countries represent ~ 86.8% of the films (~ 69.5% for the top 3). The top genres of films with music are Drama, Romance and Comedy. The top 10 genres represent ~ 51.8% of the films (~ 27.1% for the top 3 genres). We can therefore continue our analysis using the top 10, or top 3, countries and/or languages and/or genres when the plots are too overlapping.
Let’s now understand how the music features differ across the movies of the various genres, countries and languages!
When we imagine films, depending on their genre, a different kind of music plays in our heads. Thinking about romantic movies leads our mind to a calm, slow, romantic waltz, while we maybe associating more heavy metal playing while thinking about action movies. We therefore identified movie genre as a possible confounder and thus, created box plots and line plots for music features across movie genres. But although different melodies come to our mind about what music belongs to a certain genre of music, surprisingly, in all our plots, none of this is clearly visible. Films of different genres present quite similar characteristics regarding the music played in them. This can possibly be due to the fact that emotions in these different genres of movies are quite overlapping and so, the distribution of music features could be similar among them. We will look at this association more closely in our next section where we analyse the long term relationships between emotions and music but for now, we can clearly therefore exclude the movie genre as a possible confounders.
So as to not overcrowd this space, we have only presented 6 of our box plots. However, we invite you to download the .webarchive files: BoxPlots1 and BoxPlots2 locally and open them to interactively switch between boxplots of music features across movies of different genres, countries and languages!
From all our plots, we can clearly discern that the music in films produced in India often differs from the films produced in other countries and/or continents (US, Europe). This is also evident for the music in the films in Hindi, Tamil and Malayalam languages which is expected since these films are produced in India. We will now state the music features (and our findings corresponding to them) where we discovered a significant difference:
Let’s dance! (Dance Monkey): The outcomes of our graphs show an elevated danceability in films produced in India, as well as for films produced in the languages Telugu, Tamil and Malayalam which is expected since these are Indian languages.
Its all about energy (Jai Ho): Music in films produced in India seem to have a higher energy than music in films produced in countries such as Italy, France and UK. This is again evident from the plots of films in the Indian language.
Instrumentalness (Die Zauberflöte): In the film music of India, the instrumentalness is significantly lower than that of the other countries. Again, the same trend is seen in the music of films in the languages Tamil and Hindi.
Speechiness (Kabhi Kabhi Mere Dil Mein Khayal Aata Hai): The outcomes of our graphs show an elevated speechiness in films produced in India, as well as for films produced in the languages Telugu and Tamil which is expected since these are Indian languages. Only looking at the top 3 countries/languages, this is true throughout the years.
Turn it up! (Mama Laudaa): Music in films from India is generally louder than the one in the films from Italy, France, Germany and UK. This again applies (as expected) to the music in films in the languages Malayalam, Hindi, Tamil.
Think positive! (Bien etre): Regarding positivity, music in Indian movies has a higher track valence than movies produced in other countries. Same can be said for the films produced in the languages Malayalam, Hindi and Tamil (as expected).
Thats taking sooo long… (Symphony of the Crown, Pt.1): As a last feature where we found differences, the track duration of Indian movies is normally higher compared to that in the films produced elsewhere. Again, this can be seen (as expected) for Tamil, Hindi and Malayalam languages.
But there are also indifferent music features…for the features album popularity, acousticness, liveness and tempo, no clear distinctions could be seen in the boxplots. Keeping these variations in mind, let us now turn over to analysing the country-specific music styles.
Country-Specific Music Styles
After performing t-tests, we compared all the music features between movies of a particular country and movies from the rest of the world. We did this for the top 3 countries and as expected, this revealed significant differences in music styles:
US: The remarkably low p-values across all features, such as album popularity, album averaged track duration, acousticness, danceability, energy, instrumentalness, liveness, loudness, speechiness, tempo, and valence, strongly reject the null hypothesis that there is no distinction between the two groups. These findings suggest that not only do geographical differences exist in terms of album popularity, but specific musical attributes vary significantly between the United States and the rest of the world. American movie albums are significantly more popular than the rest of the world, which is not surprising since the US music market is the largest music market in the world, particularly on spotify (70% of the songs on Spotify’s Global Top-50 playlist were recorded by US-based artists). However, while they are much more instrumental than other countries’ music, American movie music is shorter and has a lower score in all the other music traits.
India: Album averaged track duration, acousticness, danceability, energy, liveness, loudness, speechiness, tempo and valence are all significantly greater in the music of Indian movies than for movies of other countries. This directly corresponds to the large number of festivals, dance, theatre and folk traditions which are intangible aspects of India’s cultural heritage. In exact contrast, instrumentalness is significantly lower than for movies of other countries and this is due to the fact that spotify treata “Ooh” and “aah” sounds as instrumental which are dominant in western music and not at all in India. Album popularity is significantly lower for music of Indian movies and is expected because the Spotify user base is predominantly the Americas and Europe.
UK: The results show the similarity of the music features of US and UK movies. Lots of their music styles are overlapping: American blues, jazz, rock and roll were influencing the music of the UK, just like british, irish, scottish music were influencing the American music. For this reason, the overlaps between British and American music are no surprise as they have a common history.
With all this done, let’s now focus on music and emotions!
Connecting Music with Emotions Portrayed by Movies
“Where words fail, music speaks!”
This famous quote by Hans Christian Andersen captures the very essence of music: soulful emotions!
Have you ever wondered how powerful music in movies is? Even with our eyes closed, we can feel the plot of a movie and understand the emotions conveyed by it.
Humans possess a unique ability to respond to music which in itself is a complex emotional composition! Neurophysiological research has shown that not only the emotional and memory centers in the Brain’s limbic system light up with increased blood supply, but it also actually makes you feel that emotion with the release of the appropriate neurotransmitter! So next time you get goosebumps listening to the ‘My Heart Will Go On’ from Titanic, know that you are feeling the real emotion of the song due to the release of ‘dopamine’ in your brain as a conscious emotional response!
All the various attributes of music and their potential combinations can capture rich and diverse emotions and our brain can actually decode them and make us feel them in real time! For instance, energy in a song can not only be skillfully tuned to give us joy and love but also, if so desired, convey anger, fear and/or surprise. The Fight Song by Rachel Platten and Dancing Queen by Abba convey anger and joy respectively whilst sharing a similar level of high energy!
With this background in mind, let us now embark on a journey into the heart of the dynamic interplay between the nuanced language of emotions embedded within movie plot summaries and the features of music present in the movies. In this exploration, we leveraged the power of DistilBERT, a cutting-edge transformer model, pre-trained specifically for emotion classification. DistilBERT allows us to decode the sentiment scores of love, sadness, joy, anger, fear and also surprise that lie beneath the movie plot summaries.
Preliminary Analysis
To begin with, after affecting the emotion classification of movie plot summaries using DistilBERT, we were able to visualise the distributions and pairwise correlations of emotions across movies using a scatter plot matrix. Since all the correlation coefficients were less than 0.75, we can conclude that none of the emotions are strongly correlated with one another.
Analysis of the Emotions and the Relationships between the Time Series of Emotions and Music
We now strategically zoom in on the 2 cinematic powerhouses where music and movies gel together: India and the United States of America (USA). These nations, which are the top 2 countries in our dataset, serve as the focal points for our in-depth time series analysis. As we could see previously, USA and India had 2 different music styles and it will now be interesting to see if these differences would also be present in then interlinkages between music emotions. We will further examine whether the music in these countries’ movies over the years shares a long-term relationship with the emotions portrayed by the in these countries’ movies over the years for the top 5 genres.
India
Emotions in Movies
As can be clearly seen from the violin plots above, most of the Indian movies pertaining to all the different genres have negligible sadness while a significant fraction of drama, comedy and romance movies have a moderate level of sadness. Love and surprise content remained quite negligible for all the different genres of movies and this can be linked to the fact that in general, Indian movies often have a greater content of joy and/or anger and/or fear to build up the entire story and elements of love and surprise are interspersed here and there in between to connect the dots. e.g. ‘Hum Aapke Hain Kon’. Further, as expected, a substantially larger fraction of comedy movies convey moderately high levels of joy as compared to movies of other genres. Anger remains the highest amongst movies of all the genres with action movies emerging at the top of the ‘anger’ leaderboard. A substantially larger fraction of thriller movies convey moderately high levels of fear as compared to movies of other genres. This is because such movies typically build up the suspense by creating an atmosphere of fear. ‘Dhoom’ and ‘Don’ are two good examples.
Let’s now analyse the time series of emotions and music features in Indian movies!
Time Series Analysis
A particular trend emerges quite clearly from the line plots of the movies pertaining to all the genres. The period of time from the 50s to the 80s is popularly referred to as the golden era of Indian film music. India had just become an independent nation in 1945 and so, Indian cinema was heavily influenced by patriotic fervor and centered on exhibiting the cultural ethos of India. Singers like Lata Mangeshkar and Kishore Kumar won the hearts of many people and sang remarkable songs that touch people’s hearts even today since they captured the essence of Indian culture, traditions and heritage. Classical and folk music (ragas, tanas, etc.) accompanied with classical instruments such as tabla, sitar, dholak, etc. was deeply intertwined with the issues (societal, historical, political, etc.) portrayed by the movies. This was the pre-digital age and music directors would spend hours on end with lyricists, singers, instrumentalists for each and every song in a film to ensure perfect coordination between them and craft a melodious masterpiece. The focus was more on completely immersing the people into the movie so that they could be one with the actors and experience everything which the actors would feel. Consequently, the liveness, energy, instrumentalness and acousticness in the music was high during this period. In contrast, the danceability in the music decreased during this period. Songs like ‘Mein Pal Do Pal Ka Shayar Hoon’ and ‘Kabhi Kabhi Mere Dil Mein Khayal Aata Hai’ are two golden examples of this! This was in particular because of the fact that singers were more concerned about making people understand and feel the content of their songs rather than making them simply dance to the beats without any understanding of the lyrics at all.
However, the period from the 80s-90s onwards saw a marked shift in this trend. Danceability suddenly started to pickup again and has only continued to increase ever since. At the same time, while the energy content of the music increased, liveness, instrumentals and acoustics of the music only decreased. This dramatic shift can be directly attributed to globalization: the time when India opened its doors to the world and consequently, got influenced by the Western music and film culture. New Indian singers (e.g., Alisha Chinai) started singing songs which were fusions of Indian and Western music with groovy beats and the Indian masses started dancing to their tunes. The focus of the film industry shifted increasingly towards the Western pop music culture, and this led to the birth of Indian pop music which was centered on high danceability more than anything else. Over the years from 1990s till date, Indian music has followed a growth trajectory guided by danceability. Lyrics and classical instruments which were hallmarks of Indian music during the golden era are gradually fading away with music being digitized and revolving around the western focal point of high danceability. Bollywood in India is increasingly becoming more focused on the western philosophy of only the ‘moolah’ rules, rather than imparting its holistic and immersive experience to people to enrich their understanding.
As Acton rightly said, “History is not a burden on the memory but an illumination of the soul”. The Indian movie industry must introspect and harness its true strengths: the commitment and vitality of the past, which make India a truly unique country and set it apart from others!
Cointegration Test Results
Let’s now turn over to analysing the long term relationship between the time series of emotions and music features of Indian movies for the top 5 genres by determining whether they are cointegrated or not.
Cointegration basically refers to the long-term relationship between 2/more time series that are non-stationary but their linear combination results in a stationary time series, i.e., a time series with an integration of order 0 (I(0)). It basically determines whether the 2 time series share an underlying common trend.
We used the augmented Engle-Granger two-step cointegration test for determining the presence of a cointegration between the time series of emotions and music. Let’s us now examine our results!
The fact that all (except 2) of the emotion and music feature time series are cointegrated for India reveals the fact that over the years, music, which even today forms an integral part of all Indian movies, effectively captures the emotions over the years through an interplay of its various features.
Additionally, since we found out that all except only the above 2 time series sets are non-cointegrated with one another, we think that this might due to the lack of movies representative of such music features in our dataset and it’s possible that with a more representative dataset, even these 2 time series might be sharing long term relationships with one another.
US
Emotions in Movies
On looking at the violin plots above, we observe a higher fraction of sadness in romance, drama and comedy genres. This could be attributed to the genres’ focus on more emotional depth than action and thriller genres which tend to instead prioritise excitement and suspense. Then, as expected, joy is present in a greater number of comedy and romance movies due to the genres’ emphasis on humour and positive relationships as compared to the other three genres: action, thriller and drama. Love and surprise are again only present for a very small fraction for all movies across all the genres because these genres often emphasise other emotions (as was the case for India). Still, a fraction of the romance movies have a higher love content than what is present in movies of other genres which could be due to the relationship and emotional intimacy of love in this movie genre. Anger is notably higher and uniformly distributed across genres. Finally, fear is also well present in all these genres with the higher fraction found in thriller movies followed by action movies, indicating their emphasis on suspenseful and more intense storytelling.
Let’s now analyse the time series of emotions and music features in Indian movies!
Time Series Analysis
The time series for US movies exhibit distinctive trends in musical attributes across genres, yet notably, these remain less pronounced than the trends which we could observe in Indian movies. The most perceptible trend is the decay of acousticness across genres since 1970 which could have arisen due to the new era of digital and electronic movie production methods. Furthermore, since 1980, converging speechiness trends suggest a shared emphasis on intelligible and explicit lyrics across movies of different genres. Also, since the 90s an increase in instrumentalness scores is notably higher for thriller and action genres indicating the presence and the will to heighten the suspense and intensity as compared to that in movies of other genres. The trends for energy and tempo attributes show a slight increase in their scores suggesting the American movie industry is now favouring more dynamic compositions!
Cointegration Test Results
As before, we again conducted the cointegration tests to analyse the long term relationship between the time series of emotions and music features of American movies for the top 5 genres.
However, as compared to Indian movies, a lot of time series turned out to be non-cointegrated with one another. Let’s analyse these cases now!
The lack of cointegration for music features in thriller movies could be due to their shift in style for thematic elements influencing the tempo or instrumentalness of the associated music. On the other hand, if we focus on sadness as an emotional theme, it might experience changes in expression. Thus, emotional portrayal can result in non-stationary relationships, preventing the establishment of a stable long-run connection between thriller music features and sadness. The same case holds true for with anger wherein the absence of cointegration over time may stem from the dynamic evolution of the thriller genre, leading to variations in the utilisation of music features associated with anger. For romance movies, the lack of cointegration with joy suggests that the temporal evolution of romantic movies and their musical components may not exhibit consistent patterns with the emotion of joy. For example, modern romantic comedies like “La La Land” (2016) exhibit diverse musical styles than its predecessors such as “Casablanca”(1942) contributing to the absence of a stable long-run connection between these two. Finally, let’s focus on comedy. Its absence of cointegration with fear may be attributed to the inherent nature and purpose of comedy. Comedy movies are primarily intended to evoke laughter and amusement and employ humour to entertain the audience. Movies such as “Dumb and Dumber”(1994) or “Superbad”(2007) can be classified as very lighthearted. On the other hand, the emotion of fear typically involves a sense of threat, danger or suspense which contrasts with comedic intent such as the very famous Alfred Hitchcock’s “Psycho”.
With all this done, let’s turn to our final research question: how does music drive movies towards success!
How Does Music Drive Movies Towards Success
Music moves us. The songs of the `Dilwale Dulhania Le Jayenge and ‘Titanic’ are played at parties and by orchestras as the background music in some shops. But is the success of certain music albums also reflected in the success of the films themselves? Is there a secret recipe for film music that leads to film success? Let’s now answer that with the help of data of 2697 movies!.
For the sake of simplicity, we considered the box office revenue as the indicator of a film’s success. Our initial analysis of the box office revenues of movies in the movie metadata dataset revealed that box office revenue was correlated with the release year. “Younger” films seem to earn more! However, this could be due to inflation. Accordingly, before proceeding with our success analysis, we affected an inflation adjustment of the box office revenues and found that this correlation went away (p-value > 0.05)! Then, first of all, we compared it with different music features and to see if there was a correlation between them. This naive analysis indicated that album popularity, album averaged track duration, acousticness, danceability, energy and liveness are correlated with a movie’s box office revenue.
For all these correlated features, we then decided to experiment with a threshold between 0.3 to 0.9 (in steps of 0.1) and form treatment and control groups according to the quantile of the features at the given thresholds. We then determined if there is a significant difference in the Movie Box Office Revenue between the control and the treatment group. If this was the case, we stored this threshold. Otherwise, we didn’t. We then chose the threshold with the greatest difference in the Mean Box Office Revenue between the treatment and control groups, whilst checking that the limits of the confidence interval aren’t negative. With this procedure, we narrowed down the list of correlated features to only album popularity, album averaged track duration and liveness and obtained the optimal thresholds for each of them.
However, in order to establish any causality between any of these features and box office revenue, we need to first of all neutralize the effect of potential confounders (runtime, number of languages and number of countries). We’ve already seen that the genre and the release year of a movie have no potential influence on the box office revenue and so, we rule these out as potential confounders. Then we affected paired matching for each of these 3 music features and consequently, divided our dataset into two samples for which the distribution of the confounders is similar. The first sample, called the treatment group corresponds to high music feature values. The second sample is made up of movies with lower music feature values. High and low values were determined using the optimal thresholds determined in the previous step.
Satisfactory results were only obtained for 2 of these music features since for the album averaged track duration, results showed that there was incomplete separation or perfect prediction because of which the Maximum Likelihood Estimator didn’t exist and the propensity scores couldn’t be determined. Let’s have a look at the plots below now!
From the box office revenue distributions shown above, we can now say that a movie whose music comes from a very popular album will have statistically better revenues. The same for movie whose music has lower liveness. To some extent, we can can also say that album popularity consists of a mix of various music features (some with low values and some with high values) and hence, a comprehensive mix of music features which is popular in the eyes of the public earns brownie points for the movies! Thus, we can say that POPULAR music drives movies towards success!
Conclusion
So to conclude, yes, music moves movies, and although we sometimes forget it, it plays an essential role. Watch a film with your eyes closed, and you’ll see! Or rather, you’ll hear…
It’ll take you onboard, it’ll tell you about a culture! If the film is produced in India, it will take you on a journey through Indian festivals, dance and folk traditions. If the film is produced in the UK, you’ll hear the whisper of the Beatles, you will hear the blues, jazz and rock ‘n’ roll of the British culture.
But that’s not all! Like a friend with whom you watch the film, it will accompany your emotions. You’re shivering? It will shiver with you! Falling in love? It will be your confidante! Better than that, sometimes it will be the one to provoke your emotions.
In the end, it’s the one that will stick in your head if you like the film. Because a successful film means a successful soundtrack! But what is a hit soundtrack? Unfortunately or fortunately, we can’t give you a recipe… ask the musicians!